Chapter 3: Regenerative Outcome Indicators
Learn more about the indicators for regenerative outcomes.
Last updated 13 June 2026
Tracking outcomes help cities to understand change. Beyond that, it accounts for the impacts of interventions as well as progress in achieving various goals. The Regenerative City Framework highlights three key outcomes to track: liveability, resilience and resource optimisation.
Collectively, the outcome indicators provide a holistic view of into how truly regenerative the city is as it pursues co-benefits for the entire urban ecosystem.
❶ Liveability Indicators
Liveability indicators show the city's ability to achieve a high quality of life, a sustainable environment and a competitive economy. They reflect the underlying systems of planning, governance and collaboration, which create the enabling conditions for urban liveability.
List of Example Indicators
High Quality of Life
A high quality of life ensures residents are part of safe, inclusive and vibrant communities. Its indicators can be linked to compact urban environments, like measuring quality transport options.
Indicator | Metric |
|---|---|
Life Expectancy | Average life expectancy for inhabitants From the indicators for life expectancy and healthy life expectancy by the World Health Organization (2021) |
Resident Retention | Duration of residence in the neighbourhood district From the Inclusive Healthy Places Framework by the Gehl Institute (2018) |
Resident Satisfaction | Mean score from standardised resident satisfaction survey From the Inclusive Healthy Places Framework by the Gehl Institute (2018) |
Modal Share | Ratio of residents who take public transport, walk or bike to work From "Urban form and livability: socioeconomic and built environment indicators" by Martino, N. et al. (2021) |
Sustainable Environment
A sustainable environment safeguards the city's natural resources and biodiversity while developing with nature. Such indicators capture the interdependencies of liveability and ecosystem health.
Indicator | Metric |
|---|---|
Air Quality | Annual average air quality index From the Global Air Quality Guidelines by the World Health Organization (2021) |
Surface Water Quality | Proportion of wastewater generated in-site that is treated before release From the Urban Environment and Social Inclusion Index by the Data-driven EnviroLab (2024) |
Safe Drinking Water | Average life years lost due to waterborne diseases from exposure to unsafe drinking water From the Environmental Performance Index by the Yale Center for Environmental Law & Policy (2024) |
Ambient Noise | Proportion of residential area exceeding long-term, unhealthy noise levels threshold From an assessment of Environmental Noise in Europe by the European Environment Agency (2020) |
Green Amenity Access | Proportion of population living within 400-m walking distance of a park or green space From the Singapore Index on Cities' Biodiversity by Chan, L. et al. (2021), and A Green & Liveable City: Singapore Urban Design Guidebook by the Urban Redevelopment Authority (2015) |
Competitive Economy
A competitive economy ensures that residents have access to quality jobs and the city fosters a dynamic business environment. Indicators include measuring the multi-functionality of developments.
Indicator | Metric |
|---|---|
Income Equity | Distribution of household income within district From the Urban Indicators Guidelines by the UN-Habitat (2024) |
Employment Rate | Proportion of working-age population within the district who are employed From the Principles on Urban Policy Implementation Toolkit by the Organisation for Economic Co-operation and Development (2024), and the Inclusive Healthy Places Framework by the Gehl Institute (2018) |
Local Business | Diversity of business establishment types per district From "Urban form and livability: socioeconomic and built environment indicators" by Martino, N. et al. (2021) |
Ground Floor Activation | Proportion of ground floor frontage in active use From the Inclusive Healthy Places Framework by the Gehl Institute (2018) |
Case Study: The Superblock Programme in Barcelona, Spain
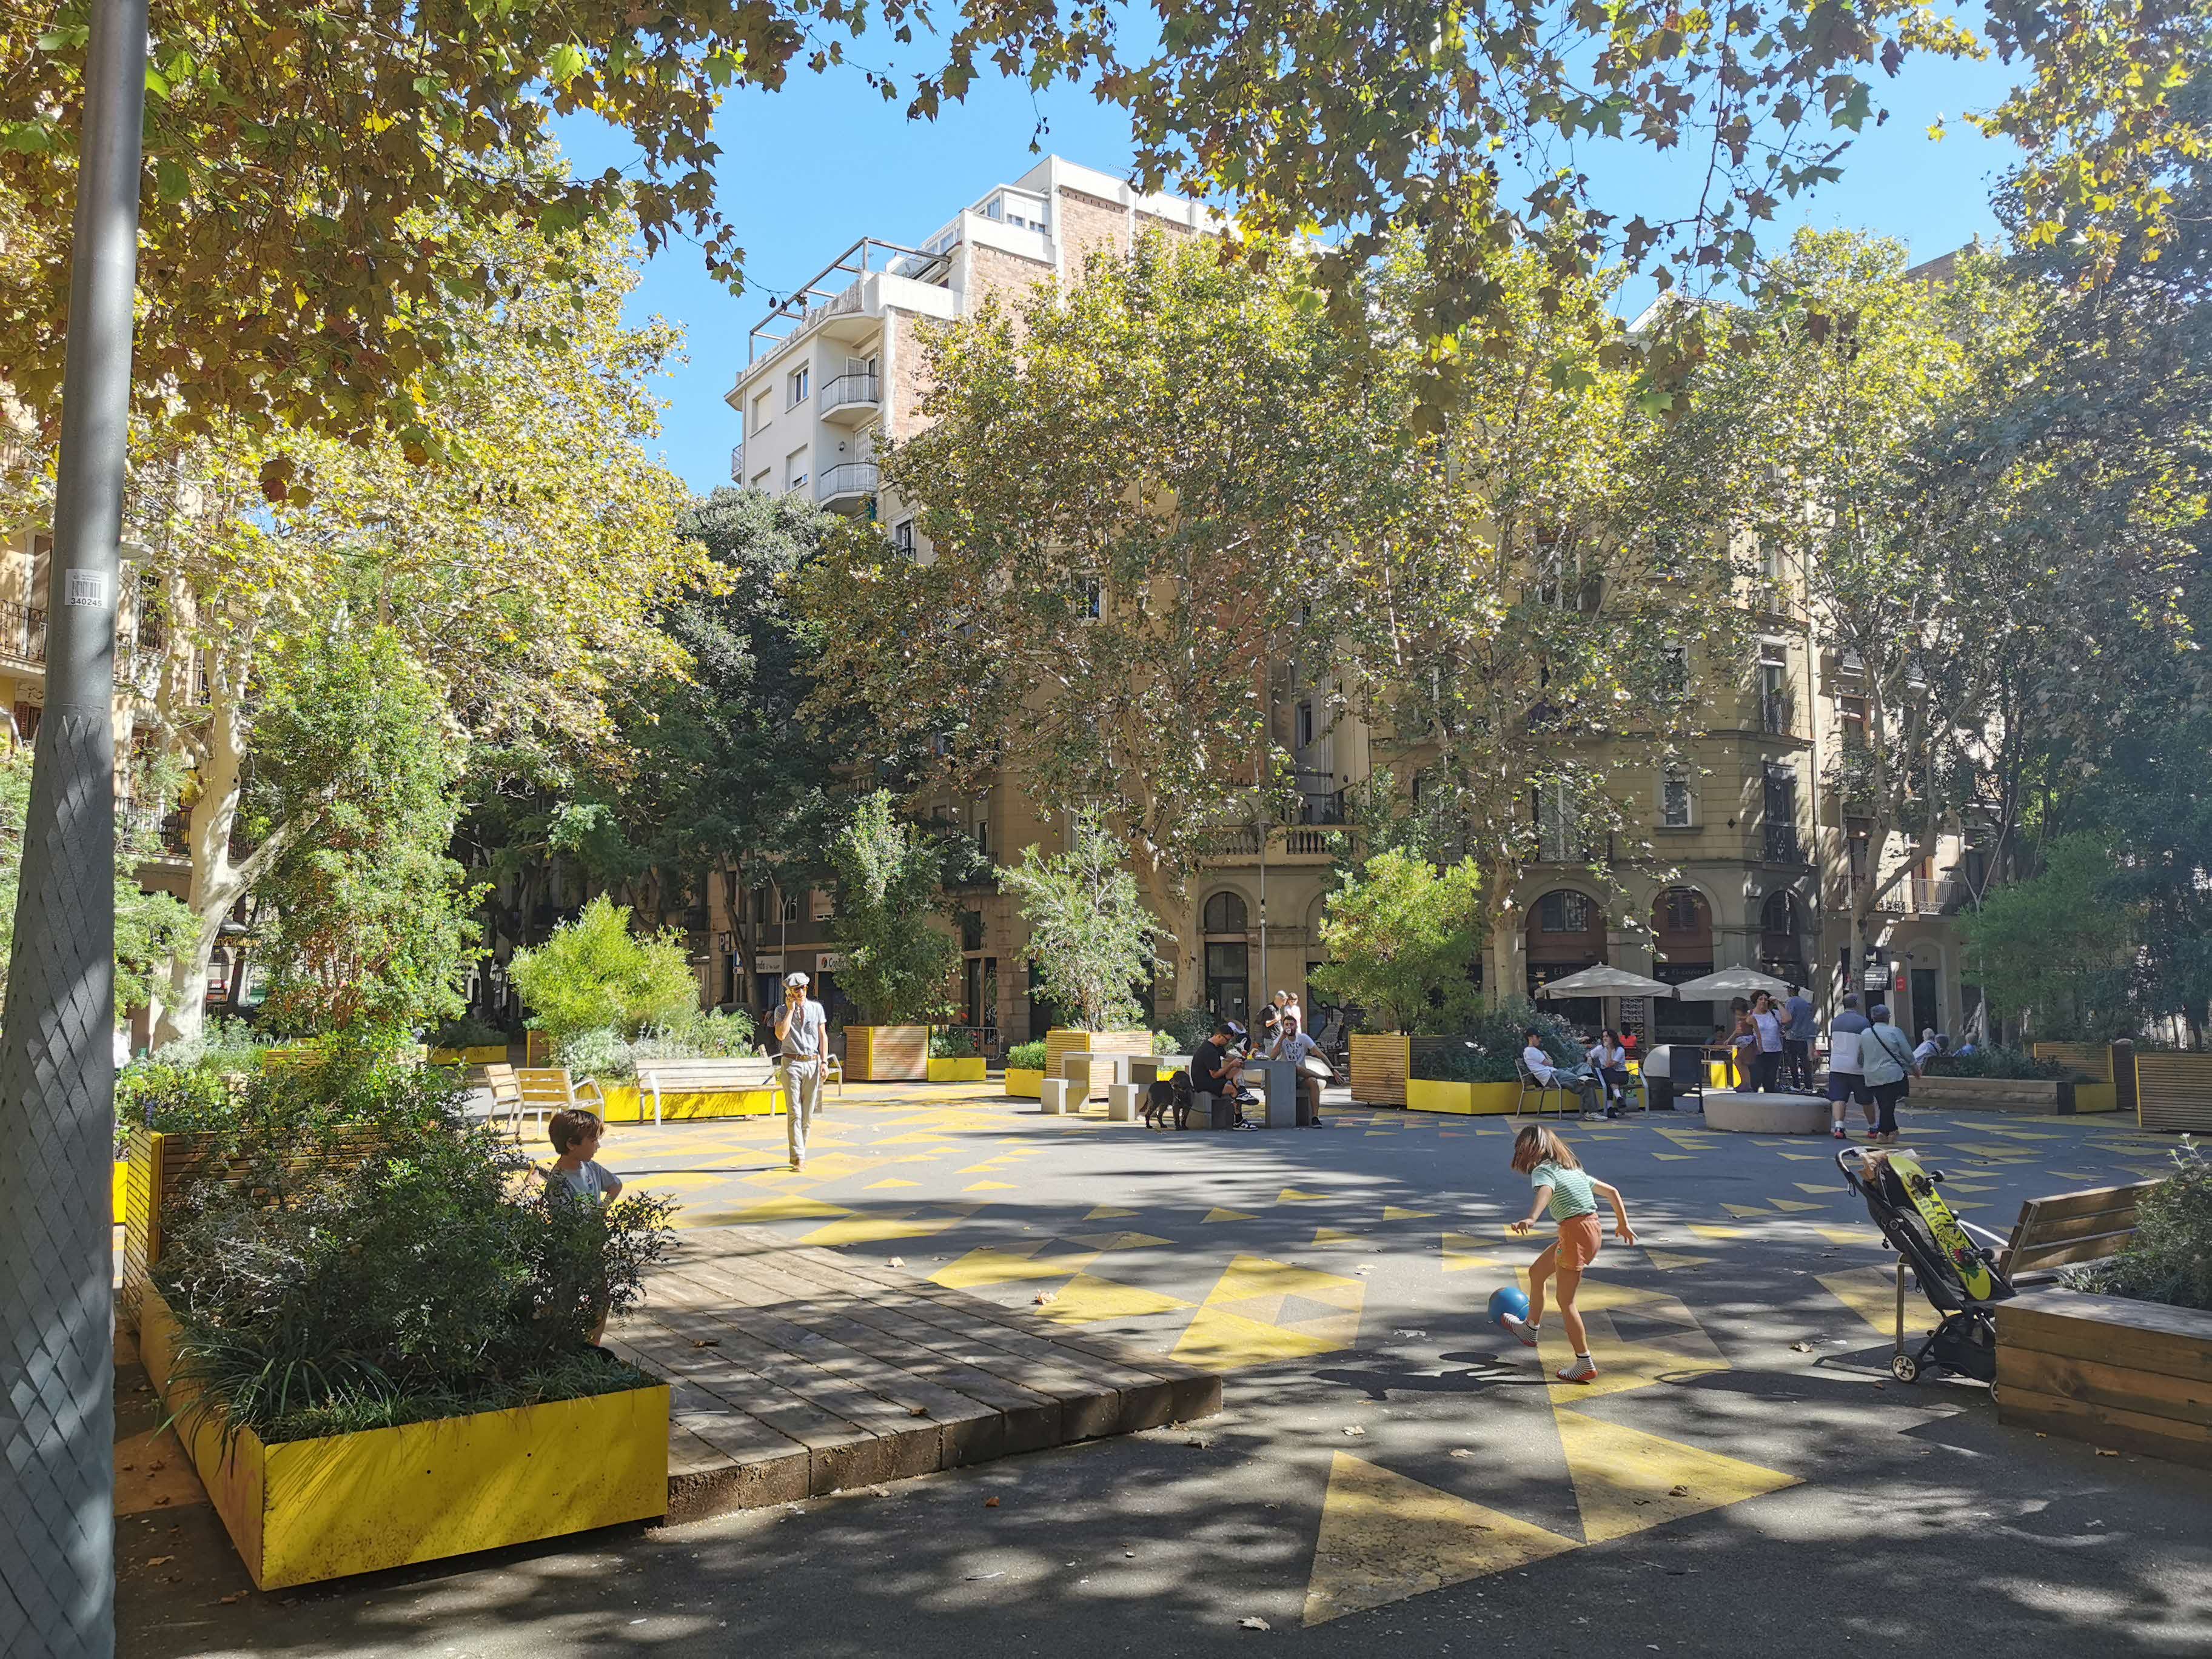
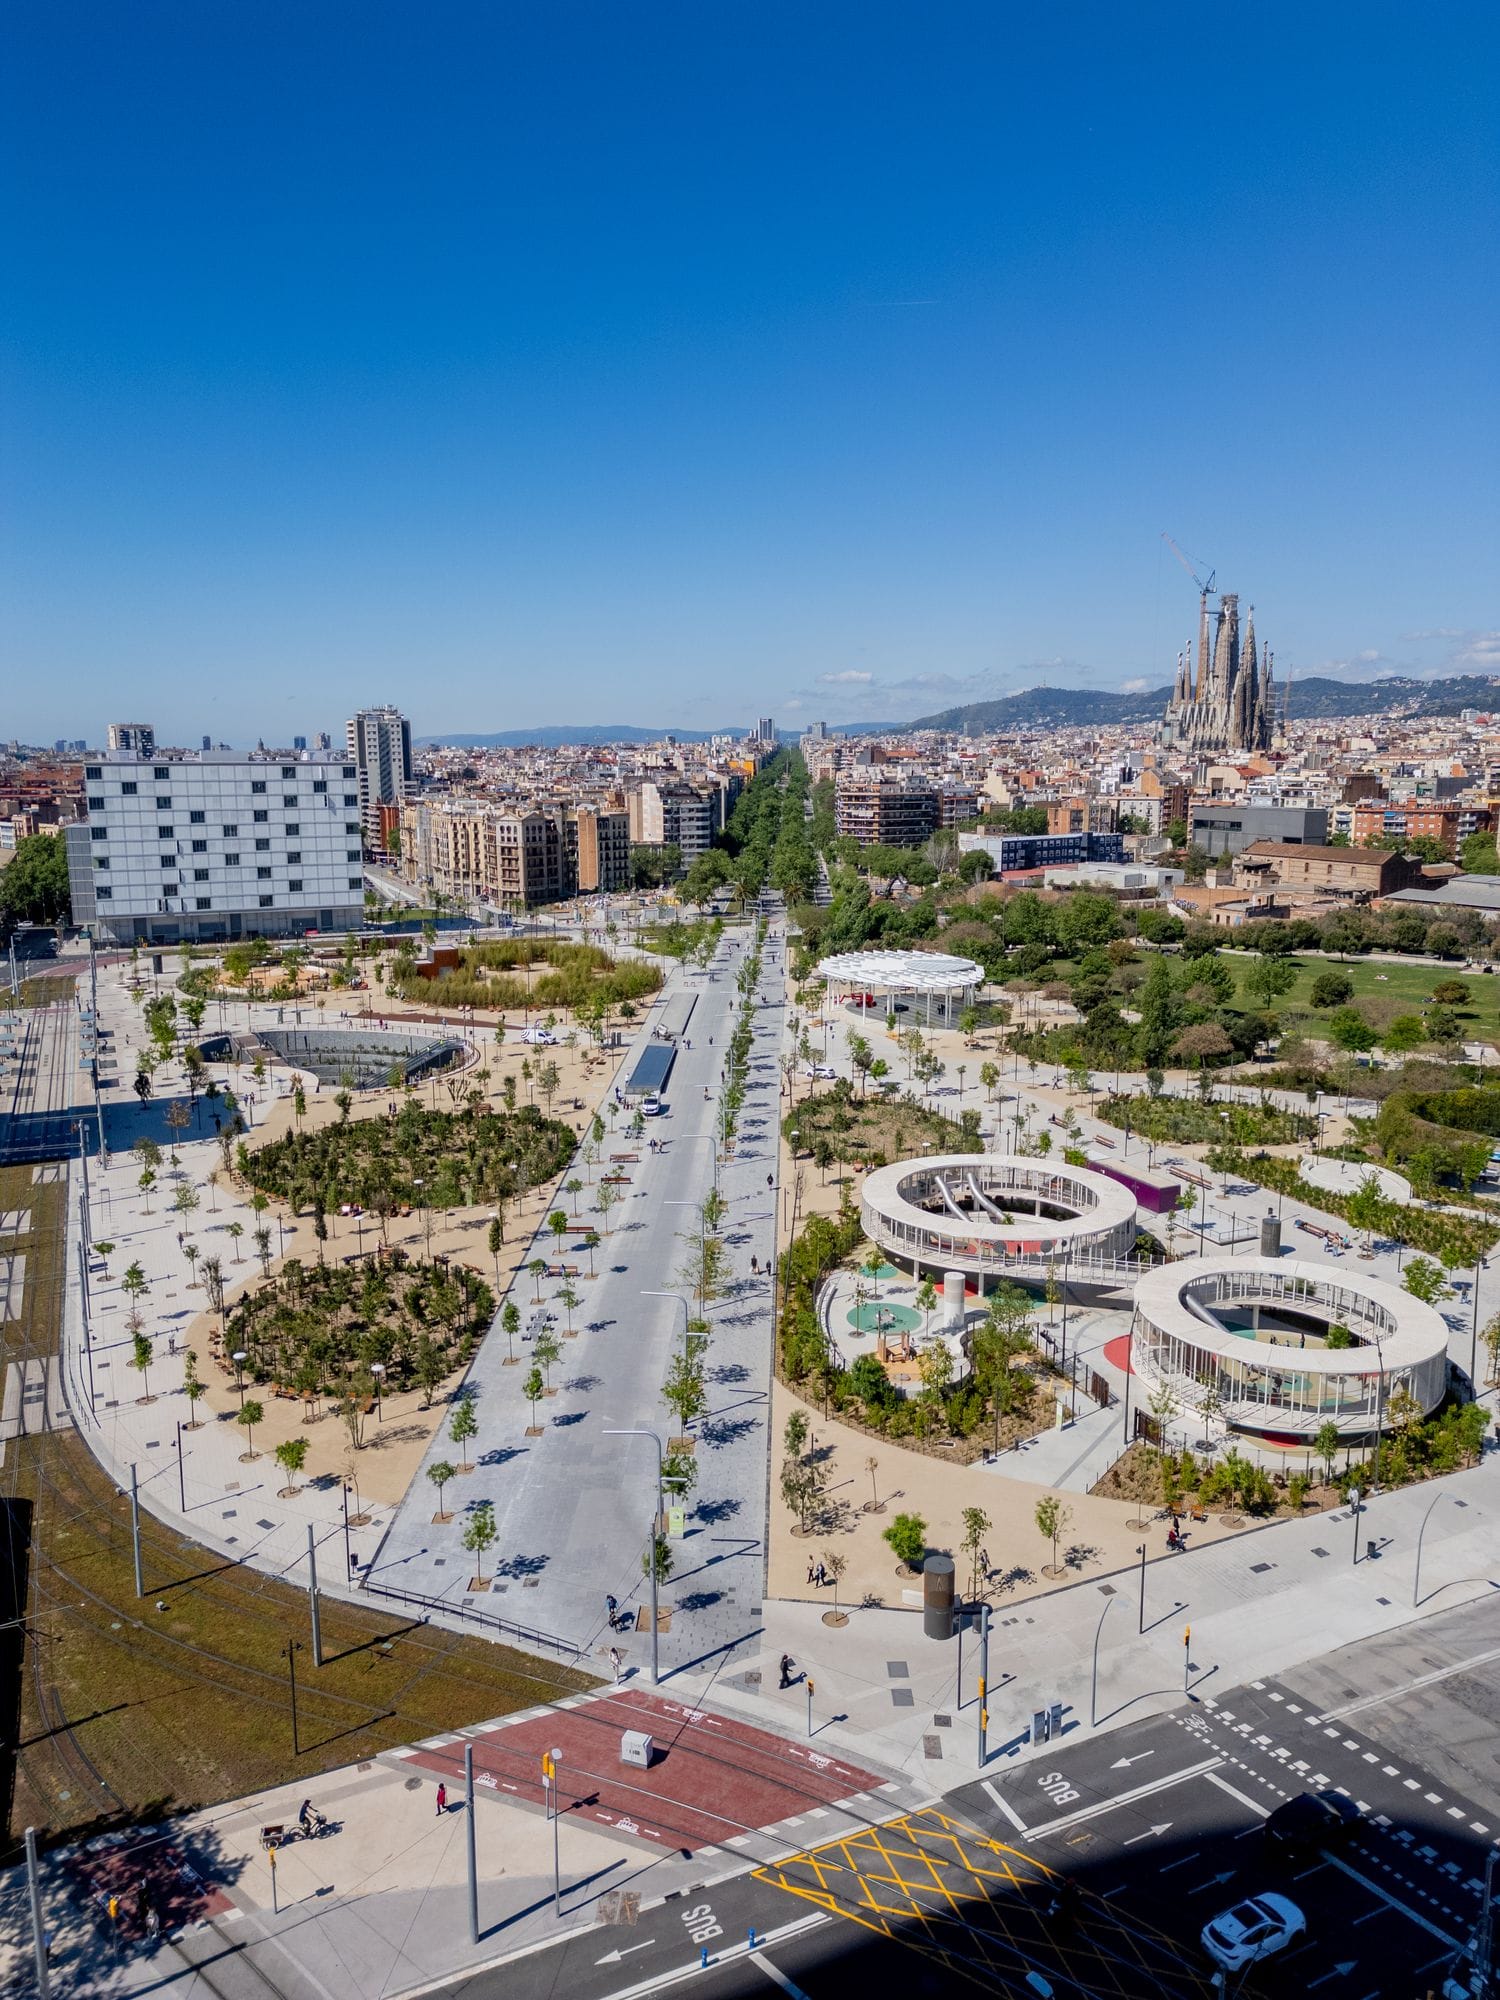
Barcelona piloted its Superblock programme in the neighbourhood of Poblenou in 2016. The reconfigured streets not only diversified mobility options and improved walkability but also increased commercial activity by more than 30%. This initiative also transformed Glòries Park, one of the city's busiest and most dangerous traffic intersections, into 30,000 m2 of green space featuring biodiversity nodes, dense native vegetation and family play areas.
❷ Resilience Indicators
Resilience indicators reflect the ability of the city's people, communities, institutions, businesses and systems to prepare and plan for, absorb, recover from and successfully adapt to adverse events.
List of Example Indicators
Climate Resilience
Climate resilience indicators measure the effectiveness of climate change mitigation and adaptation efforts, as well as adaptive capacity for climate impacts.
Indicator | Metric |
|---|---|
Urban Heat Reduction | Change in mean land surface temperature From “Landscape configuration and urban heat island effects: assessing the relationship between landscape characteristics and land surface temperature in Phoenix, Arizona” by Connors, J.P., Galletti, C.S. & Chow, W.T.L. (2013) |
Flood Risk Exposure | Proportion of area in the district at risk of flooding in 100 years From Chapter 15 of Climate Change: Impacts, Adaptation and Vulnerability under IPCC AR6 (2022) |
Runoff Volume Control | Proportion of rainfall retained and reused on-site From “Evaluating Sponge City volume capture ratio at the catchment scale using SWMM” by Randall, M. et al. (2019) |
Water Stress | Ratio of freshwater reserves to population size From "Macro-scale water scarcity requires micro-scale approaches" by Falkenmark, M., Lundqvist, J. & Widstrand, C. (1989) |
Environmental Resilience
Environmental resilience indicators measure ecosystem health through cumulative quantity, diversity and quality of non-human life within the urban area and its hinterland.
Indicator | Metric |
|---|---|
Green Space | Area of healthy vegetation cover using the normalised difference vegetation index From “Development of a global urban greenness indicator dataset for 1,000+ cities” by Stowell, J.D. et al. (2023) |
Plant Species Richness | Number of native plant species per survey area From the Singapore Index on Cities' Biodiversity by Chan, L. et al. (2021) |
Bird Species Richness | Number of native bird species per survey period From the Singapore Index on Cities' Biodiversity by Chan, L. et al. (2021) |
Soil Health | Amount of soil lost through water erosion per year From “How the EU Soil Observatory is providing solid science for healthy soils” by Pangoes, P. et al. (2024) |
Habitat Restoration | Proportion of area of restored habitat against area of degraded habitat From the Singapore Index on Cities' Biodiversity by Chan, L. et al. (2021) |
Social Resilience
Social resilience indicators, such as the prevalence of civic participation and social cohesion indices, gauge the capacity of communities to respond to disruptions.
Indicator | Metric |
|---|---|
Civic Participation | Number of urban community resident associations From “Critical review of urban community resilience indicators” by Osei-Kyei, R. et al. (2023) |
Social Cohesion | Extent of local community's interpersonal trust and institutional trust From the Guidelines on Measuring Trust by the Organisation for Economic Co-operation and Development (2017) |
Local Environmental Stewardship | Extent of local community's involvement in the stewardship of the environment From “LESI: A quantitative indicator to measure local environmental stewardship” by Turnbull, J.W., Johnston, E.L. & Clark, G.F. (2020) |
Case Study: Kranji Coastal Nature Park in Singapore
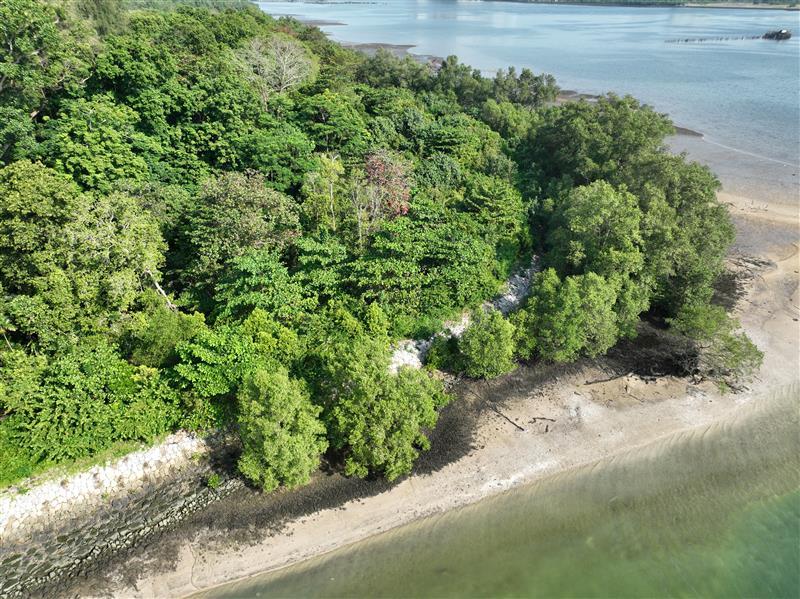
A low rock revetment installed at Kranji Coastal Nature Park in 2019 facilitates the natural regeneration of mangroves and coastal vegetation. (National Parks Board)
Kranji Coastal Nature Park is a buffer park abutting the Sungei Buloh Wetland Reserve, and where natural regeneration of mangroves was employed for coastal resilience. As part of coastal protection efforts, a 400-m-long low rock barrier was implemented to slow down wave energy for sediments to settle and mangroves to recruit naturally along the coast. Landward of the barrier, a 4,900-m2 coastal vegetation belt was established through a specially curated planting palette to mirror the natural transition from inland forest to coastal and mangrove ones. Over 70 species of plant were selected and planted on site with 1,600 community participants. (By National Parks Board)
❸ Resource Optimisation Indicators
Resource optimisation indicators point to the degree to which food, material, carbon, water and land are used and kept in continuous circulation to minimise extraction, waste and environmental degradation, while allowing for growth.
List of Example Indicators
Carbon
Carbon indicators are premised on scientific consensus around carbon accounting methodologies.
Indicator | Metric | |
|---|---|---|
Greenhouse Gas Emissions Intensity | Total amount of CO₂e per resident per year From the Global Protocol for Community Scale GHG Emission Inventories (GPC) by the World Resources Institute, C40 Cities and ICLEI (2021) | |
Stationary Combustion | Amount of CO₂e from stationary fuel combustion within district boundary per year From the GPC by the World Resources Institute, C40 Cities and ICLEI (2021) | |
Transport | Amount of CO₂e from transportation within district boundary per year From the GPC by the World Resources Institute, C40 Cities and ICLEI (2021) | |
Agriculture Forestry and Other Land Use Change | Amount of CO₂e from agriculture forestry and other land use change within district boundary per year From the GPC by the World Resources Institute, C40 Cities and ICLEI (2021) | |
Industrial Processes | Amount of CO₂e from industrial processes and product use within district boundary per year From the GPC by the World Resources Institute, C40 Cities and ICLEI (2021) | |
Waste and Wastewater Emissions | Amount of CO₂e from waste and wastewater treatment within district boundary per year From the GPC by the World Resources Institute, C40 Cities and ICLEI (2021) | |
Grid-supplied Energy | Amount of CO₂e from purchased grid electricity and heat per year From the GPC by the World Resources Institute, C40 Cities and ICLEI (2021) | |
Land
Land indicators assess how integrated developments are through the compactness of land use and co-location of amenities.
Indicator | Metric | |
|---|---|---|
Land Use Compactness | Spatial autocorrelation index of built-up density From "Measuring Urban Sprawl: How Can We Deal With It?" by Frenkel, A. & Ashkenazi, M. (2008) | |
Water
Water indicators track progress toward water security and circular water management.
Indicator | Metric | |
|---|---|---|
Water Consumption Index | Daily average of potable water consumption per resident From "Assessing water circularity in cities: methodological framework with a case study" by Arora M. et al. (2022) | |
Materials
Material indicators track progress toward a circular economy for material flows through the rate of recycling and building reuse.
Indicator | Metric | |
|---|---|---|
Waste Recycling | Proportion of total municipal solid waste diverted from landfill through recycling or reuse per year From the “CityLoops urban circularity assessment method” by Bellstedt, C. et al. (2022) | |
Building Reuse Rate | Proportion of construction permits for renovation or adaptive reuse per year From Regenerative by Design: Creating Living Buildings and Cities by David Cheshire (2024) | |
Food
Food indicators track progress toward food security and resilience, measuring production and consumption patterns that support urban agriculture ecosystems.
Indicator | Metric | |
|---|---|---|
Local Food Production | Proportion of total consumed food sourced from within the city or peri-urban region From the Singapore Index on Cities' Biodiversity by Chan, L. et al. (2021) | |
Case Study: The Kalundborg Symbiosis in Kalundborg, Denmark
.jpeg)
.jpg)
Developed in 1972, the Kalundborg Symbiosis is the world's first industrial symbiosis, involving 17 public and private partners. The network connects resource and waste streams, creating a circular ecosystem that synergistically leverages residual and surplus by-products across organisations. As it transitions towards net zero, the ecosystem is generating multiple co-benefits, including economic growth, and savings of 4 million m3 of groundwater and 62,000 tonnes of residual materials annually.
Over time, tracking these outcomes enable cities to better understand regenerative interventions by comparing their before and after impacts. Progressive comparison provides insights into the effectiveness of actions, enabling cities to determine where course correction is needed. This is further amplified by a clear understanding of the city's regenerative capacity.
Download Chapter 3 PDF [PDF, 1.07 MB]
Download Full Publication PDF [PDF, 29.60 MB]